The first post-announcement benchmark of the GeForce RTX 3080 graphics cards.
NVIDIA GeForce RTX 3080: 168% of RTX 2080 performance

The GeForce RTX 3080 has been put through a number of CUDA and OpenCL tests with the Compubench benchmark suite.
The GeForce RTX 3080 graphics card has been tested using 456.16 drivers. The OpenCL info page reveals its a 10GB variant with 68 Compute Units (Streaming Multiprocessors) and 1710 MHz boost frequency. This is either the Founders Edition model tested by one of the reviewers or a custom variant featuring the same clock speed. The CUDA info page confirms its a 320-bit memory configuration with 19 Gbps modules.
These types of tests are compute oriented and do not illustrate gaming performance at all. Especially when we take all the new hardware to accelerate technologies (such as RTX or DLSS) into account.
| NVIDIA GeForce RTX 3080 on Compubench | |||
|---|---|---|---|
| OpenCL C 1.2 | CUDA | Value | Comments |
| CL_DEVICE_MAX_COMPUTE_UNITS | CU_DEVICE_ATTRIBUTE_MULTIPROCESSOR_COUNT | 68 | SM |
| CL_DEVICE_GLOBAL_MEM_SIZE | 10737418240 | 10 GB | |
| CU_DEVICE_ATTRIBUTE_GLOBAL_MEMORY_BUS_WIDTH | 320 | bit | |
| CL_DEVICE_MAX_CLOCK_FREQUENCY | CU_DEVICE_ATTRIBUTE_CLOCK_RATE | 1710 | MHz |
| CU_DEVICE_ATTRIBUTE_MEMORY_CLOCK_RATE | 9501000 | 19 Gbps | |
| CU_DEVICE_ATTRIBUTE_L2_CACHE_SIZE | 5242880 | 5.1 MB L2 |
NVIDIA RTX 3080 performance
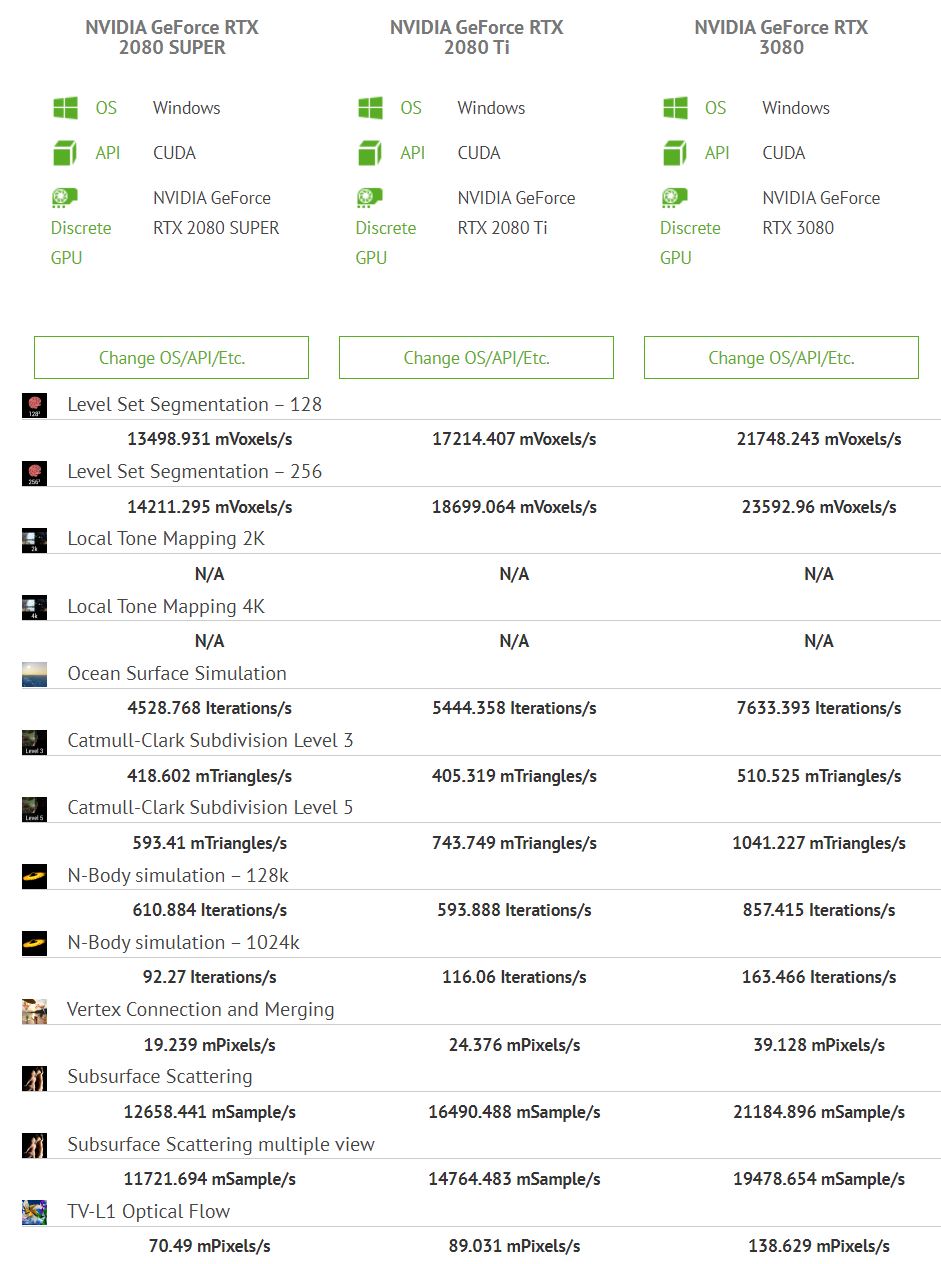
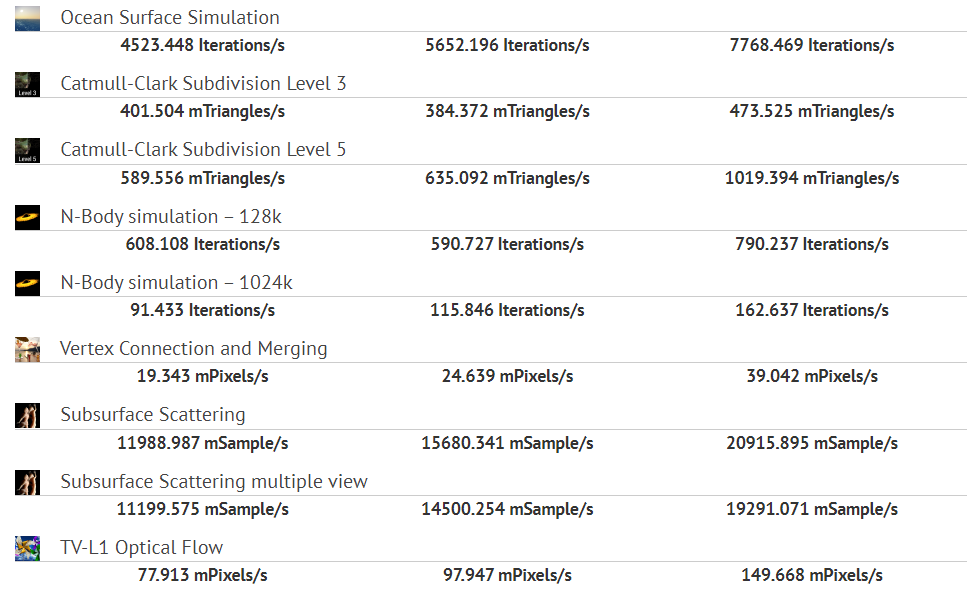
We gathered the data for both CUDA and OpenCL tests. The average for both tests, however, is more or less the same. The RTX 3080 has on average 168% of RTX 2080 SUPER performance and 138-141% performance of the RTX 2080 Ti.
| NVIDIA GeForce RTX 3080 CUDA Performance | |||||||
|---|---|---|---|---|---|---|---|
| VideoCardz.com | Unit | RTX 2080 SUPER | RTX 2080 Ti | RTX 3080 | RTX 2080Ti/ RTX 2080S | RTX 3080/ RTX 2080S Ti | RTX 3080/ RTX 2080S |
| Level Set Segmentation – 128 | mVoxels/s | 13498.9 | 17214.4 | 21748.2 | 128% | 126% | 161% |
| Level Set Segmentation – 256 | mVoxels/s | 14211.3 | 18699.1 | 23593.0 | 132% | 126% | 166% |
| Ocean Surface Simulation | Iterations/s | 4528.8 | 5444.4 | 7633.4 | 120% | 140% | 169% |
| Catmull-Clark Subdivision Level 3 | mTriangles/s | 418.6 | 405.3 | 510.5 | 97% | 126% | 122% |
| Catmull-Clark Subdivision Level 5 | mTriangles/s | 593.41 | 743.7 | 1041.2 | 125% | 140% | 175% |
| N-Body simulation – 128k | Iterations/s | 610.9 | 593.9 | 857.4 | 97% | 144% | 140% |
| N-Body simulation – 1024k | Iterations/s | 92.3 | 116.1 | 163.5 | 126% | 141% | 177% |
| Vertex Connection and Merging | mPixels/s | 19.2 | 24.4 | 39.1 | 127% | 161% | 203% |
| Subsurface Scattering | mSample/s | 12658.4 | 16490.5 | 21184.9 | 130% | 128% | 167% |
| Subsurface Scattering multiple view | mSample/s | 11721.7 | 14764.5 | 19478.7 | 126% | 132% | 166% |
| TV-L1 Optical Flow | mPixels/s | 70.5 | 89.0 | 138.6 | 126% | 156% | 197% |
| AVERAGE | 138% | 168% | |||||
| NVIDIA GeForce RTX 3080 OpenCL Performance | |||||||
| Ocean Surface Simulation | Iterations/s | 4523.5 | 5652.2 | 7768.5 | 125% | 137% | 172% |
| Catmull-Clark Subdivision Level 3 | mTriangles/s | 401.5 | 384.4 | 473.5 | 96% | 123% | 118% |
| Catmull-Clark Subdivision Level 5 | mTriangles/s | 589.6 | 635.1 | 1019.4 | 108% | 161% | 173% |
| N-Body simulation – 128k | Iterations/s | 608.1 | 590.7 | 790.2 | 97% | 134% | 130% |
| N-Body simulation – 1024k | Iterations/s | 91.4 | 115.9 | 162.6 | 127% | 140% | 178% |
| Vertex Connection and Merging | mPixels/s | 19.3 | 24.6 | 39.0 | 127% | 158% | 202% |
| Subsurface Scattering | mSample/s | 11989.0 | 15680.3 | 20915.9 | 131% | 133% | 174% |
| Subsurface Scattering multiple view | mSample/s | 11199.6 | 14500.3 | 19291.1 | 129% | 133% | 172% |
| TV-L1 Optical Flow | mPixels/s | 77.9 | 97.9 | 149.7 | 126% | 153% | 192% |
| AVERAGE | 141% | 168% |
CUDA performance
OpenCL performance
NVIDIA GeForce RTX 3080 specifications
NVIDIA GeForce RTX 3080 features 8nm GA102-200 GPU with 8704 CUDA cores. The graphics card is paired with 10GB of next-generation GDDR6X memory across 320-bit memory bus.
The graphics card will officially go on sale on September 17th. Reviewers are expected to post their benchmarks of the Founders Edition on September 14th, with custom models reviews 3 days later.
| NVIDIA GeForce RTX 30 Series Specifications | ||||
|---|---|---|---|---|
| VideoCardz.com | RTX 3090 | RTX 3080 | RTX 3070 | RTX 2080 Ti |
| Picture | 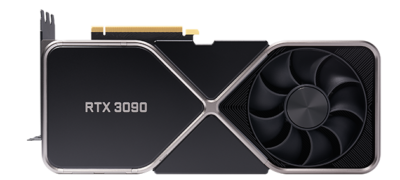 | 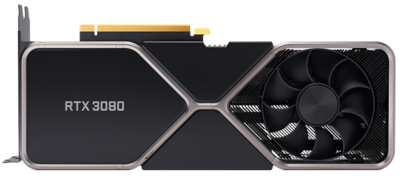 | 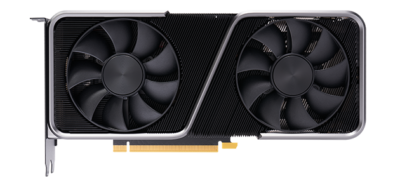 | 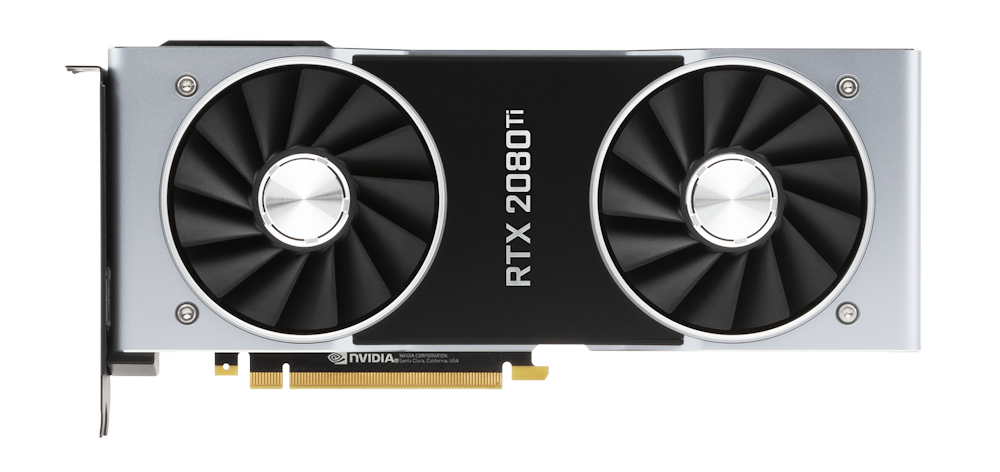 |
| Board | PG132 SKU 30 | PG132 SKU 10 | PG142 SKU 10 | PG150 SKU 32 |
| GPU | 8nm GA102-300 | 8nm GA102-200 | 8nm GA104-300 | 12nm TU102-300 |
| Die Size | 628 mm2 | 628 mm2 | 392 mm2 | 754 mm2 |
| Transistors | 28 B | 28 B | 17.4 B | 18.6 B |
| CUDA Cores | 10496 | 8704 | 5888 | 4352 |
| Tensor Cores | 328 (4 per SM) | 272 (4 per SM) | 184 (4 per SM) | 544 (8 per SM) |
| RT Cores | 82 | 68 | 46 | 68 |
| Base Clock | 1395 MHz | 1440 MHz | 1500 MHz | 1350 MHz |
| Boost Clock | 1695 MHz | 1710 MHz | 1725 MHz | 1545 MHz |
| Shader Perf. | 35.6 TFLOPS | 29.8 TFLOPS | 20.3 TFLOPS | 13.4 TFLOPS |
| RT Perf. | 285 TFLOPS | 238 TFLOPS | 163 TFLOPS | 110 TFLOPS |
| Memory | 24GB G6X | 10GB G6X | 8GB G6 | 11GB G6 |
| Memory Clock | 19.5 Gbps | 19 Gbps | 14 Gbps | 14 Gbps |
| Memory Bus | 384-bit | 320-bit | 256-bit | 352-bit |
| Bandwidth | 936 GB/s | 760 GB/s | 441 GB/s | 616 GB/s |
| TDP | 350W | 320W | 220W | 250W |
| MSRP | $1499 | $699 | $499 | $999 |
Source: Compubench