MSI CLAW Vs ASUS ROG Ally

While official reviews of the MSI Claw may not be out yet, some Chinese media outlets have managed to get their hands on early samples, allowing for a side-by-side comparison with ASUS handhelds. The ROG Ally serves as the ideal counterpart for the Claw, sharing the same screen size, resolution, and 16GB LPDDR5-6400 memory configuration.
Given that MSI and ASUS often compete in different PC component markets, this comparison is eagerly awaited by many. Chinese media conducted various game tests, acknowledging the challenge of comparing two different devices. Although multiple test runs per benchmark would be ideal, early footage only provides glimpses and single runs, which may not fully illustrate both systems’ performance.
The tests involved different power levels, an important factor when testing handheld devices. Both companies offer easy TDP profile switches, allowing users to adjust performance based on the game’s requirements or available battery life. The Claw’s larger battery could theoretically offer more gaming time or higher TDP with the same battery life. The system can work at 40W TDP level (but in reality it’s between 35 and 40 watts).
In the Shadow of the Tomb Raider test, the Claw doesn’t seem to outperform the ROG Ally. According to a Bilibili creator’s test, the system falls short at four different power levels: 15W, 20W, 25W, and max TDP (40W for Claw and 30W for Ally).


MSI Claw 155H ROG ALLY Z1E, Source: 拜托了小峰峰 发消息 (Bilibili)
We have added some data to the chart for a better understanding of what is being tested.
| MSI CLAW vs ASUS ROG ALLY (FPS) | ||||
|---|---|---|---|---|
| VideoCardz | Settings | TDP | MSI CLAW | ASUS ROG ALLY |
| Cyberpunk 2077 | 1600×900 Low Quality, FSR & XeSS Performance | Max TDP | 44.8 | 59.8 |
| Shadow of the Tomb Raider | 1280×720 High Quality Preset | Max TDP | 49 | 53 |
| 25W | 46 | 56 | ||
| 20W | 40 | 53 | ||
| 15W | 24 | 42 | ||
| Red Dead Redemption 2 | 1600×900 Low Quality, FSR 2.1 Performance | Max TDP | 49.2 | 60.2 |
| Resident Evil | 1600×900 Low Quality, FSR 2.1 Performance | Max TDP | 21-53 | 51-68 |
Some reviewers also had the opportunity to test the second variant of the MSI Claw, reportedly equipped with the Core 5 Ultra 135H processor and an integrated Arc GPU featuring 7 Xe-Cores. This configuration includes 2 CPU cores and 1 Xe-Core less than the Core 7 Ultra 155H. Despite the relatively minor spec differences, a performance gap was observed in a test, specifically in Cyberpunk 2077.


MSI Claw 155H vs 135H vs ROG ALLY Z1E, Source: 橘子佛系测评 (Bilibili)
In this test, the average FPS was reported as 22.53 on the 135H variant and 29.78 on the 155H variant. Unfortunately, the reviewer did not display the benchmark result screen at all times.


MSI Claw 155H ROG ALLY Z1E, Source: 拜托了小峰峰 发消息 (Bilibili)
It’s important to note that reviewers might have employed drivers different from those that will be available upon the product’s official release. Intel seems to be providing access to their Arc GPU drivers for the Meteor Lake series, no matter the product, which made these tests possible.
Both reviews also include a thorough side-by-side analysis of the controller setups, screens, and speaker configurations. It’s definitely worth a look if you’re interested. We are expecting that there will be a separate embargo lift for international media at some point, with the product release slated for early April.
| Handheld Gaming Consoles Specs | ||||
|---|---|---|---|---|
| VideoCardz | MSI Claw | ASUS ROG Ally | Lenovo Legion Go | Valve Steam Deck |
| Picture | 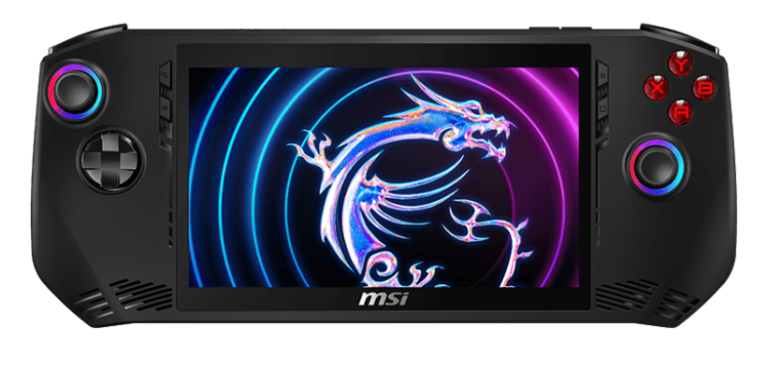 | 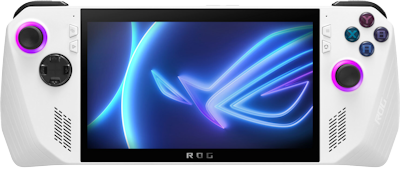 | 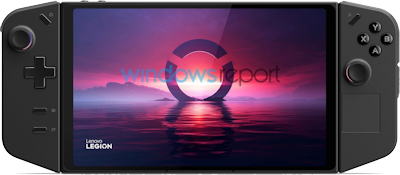 | 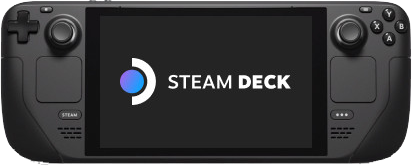 |
| Architecture | Intel Redwood Cove, Crestmont & Xe-LPG | AMD Zen4 & RDNA3 | AMD Zen4 & RDNA3 | AMD Zen2 & RDNA2 |
| APU | Core 7 Ultra 155H 16C/22T up to 4.8 GHz or Core 5 Ultra 135H 14C/18T up to 4.6 GHz | Ryzen Z1 Extreme 8C/16T up to 5.1 GHz or Ryzen Z1 6C/12T up to 4.9 GHz | Ryzen Z1 Extreme 8C/16T up to 5.1 GHz or Ryzen Z1 6C/12T up to 4.9 GHz | AMD Van Gogh 4C/8T up to 3.5 GHz |
| SoC GPU | Arc Graphics 8 Xe-C @ 2.25 GHz [155H] 7 Xe-C @ 2.20 GHz [135H] | AMD iGPU 12CU @ 2.7 GHz [Z1E] 4CU @ 2.5 GHz [Z1] | AMD iGPU 12CU @ 2.7 GHz [Z1E] 4CU @ 2.5 GHz [Z1] | AMD iGPU 8CU @ 1.6 GHz |
| SoC TDP | 28W | 9-30W | 9-30W | 4-15W |
| External GPU | Thunderbolt 4 | ROG XG Mobile (up to RTX 4090) | USB4 | Not officially |
| Memory Capacity | 16GB LPDDR5-6400 | 16GB LPDDR5-6400 | 16GB LPDDR5X-7500 | 16GB LPDDR5-5500 |
| Storage Capacity | 1TB/512GB | 512GB | 1TB/512GB | 256GB/512GB SSD 64GB eMMC |
| Storage Type | M.2 NVMe 2230 SSD PCIe 4×4 | M.2 NVMe 2230 SSD PCIe 4×4 | M.2 NVMe 2242 SSD PCIe 4×4 | M.2 NVMe 2230 SSD PCIe 3×4 eMMC PCIe Gen2x1 |
| Display | 7″ 1920×1080, 120Hz, 500 nits, VRR | 7″ 1920×1080, 120Hz, 500 nits, 7ms, VRR | 8.8″ 2560×1600 IPS, 144Hz, 500 nits | 7″ 1280×800, 60Hz |
| Connectivity | Wi-Fi 7 + Bluetooth 5.4 | Wi-Fi 6E, BT 5.2 | Wi-Fi 6E, BT 5.2 | Wi-Fi 5, BT 5 |
| Battery | 6-Cell 53 Battery (Wh) | 40 Wh, 4S1P, 4-cell Li-ion | 49.2 Wh, 900 mAh (controllers) | 40 Wh |
| Weight | 675 g | 608g / 1.34 lbs | 854g / 1.87 lbs | 669g / 1.47 lbs |
| Dimensions (L × W × H) | 29.4 × 11.7 × 2.1 cm 11.6 × 4.6 × 0.8 in | 28.0 × 11.3 × 3.9 cm 11.0 × 4.5 × 1.5 in | 29.9 × 13.1 × 4.1 cm 11.8 × 5.2 × 1.6 in | 29.8 × 11.7 × 4.9 cm 11.7 × 4.6 × 1.9 in |
| Default OS | Windows 11 | Windows 11 | Windows 11 | Steam OS/Win 11 |
| Retail Price | $799/€929 [155HU+1TB] $749/€879 [155H+512GB] $699 [135H+512GB] | $599/€699 [Z1] $699/€799 [Z1E] | $699/€799 [1E+512GB] $749/€799 [Z1E+1TB] | $399/€419 (16G+64GB) $529/€549 (16G+256GB) $649/€679 (16G+512GB) |
| Release Date | April 2024 | June 2023 [Z1E] September 2023 [Z1] | October 31, 2023 | February 2022 |
Sources: 拜托了小峰峰 发消息 (Bilibili): (main video 30W) , (40W comparison) , 橘子佛系测评 (Bilibili)